Xerini: Minimally orchestrates SQL scripts
Toy Example
Suppose you have the following script in a file called simple.sql
You can use
sciurus to write the following python script:
In[1]:
from xerini.script import Script

In[2]: code = Script.from_file("simple.sql")

In[3]:
for stmt in code.statements:
    ...: print(f"the set {stmt.source_tables} sends data to {stmt.affected_table}.")
    ...:
the
set
set()
sends
data
to
my_data.
the
set
{'demographics'}
sends
data
to
my_data.
For a given
SQL script, sciurus will split it into statements, and for each statement identify the sources tables and the affected tables.Running
will produce
simple.dot.svg |
|---|
 |
Another Example
We can do the same thing using a slightly more elaborated script generated by GoogleGemini:
-- Large CTAS (CREATE TABLE AS SELECT) SQL Script Example: Data Warehouse Transformation

-- This script simulates a complex data transformation and aggregation for a data warehouse.
-- It involves multiple joins, aggregations, window functions, and data type conversions.

-- Assuming we have source tables:
--   - sales_transactions (transaction_id, customer_id, product_id, sale_date, sale_amount, quantity)
--   - customers (customer_id, customer_name, region, signup_date)
--   - products (product_id, product_name, category, price)
--   - date_dim (date_id, full_date, year, month, day, day_of_week)

CREATE TABLE aggregated_sales_summary AS
SELECT
    dd.year,
    dd.month,
    c.region,
    p.category,
    SUM(st.sale_amount) AS total_sales,
    AVG(st.sale_amount) AS average_sale,
    COUNT(DISTINCT st.customer_id) AS unique_customers,
    COUNT(st.transaction_id) AS total_transactions,
    SUM(st.quantity) AS total_quantity,
    MAX(st.sale_date) AS latest_sale_date,
    MIN(st.sale_date) AS earliest_sale_date,
    -- Window functions for ranking and running totals
    RANK() OVER (PARTITION BY dd.year, dd.month, c.region ORDER BY SUM(st.sale_amount) DESC) AS sales_rank,
    SUM(SUM(st.sale_amount)) OVER (PARTITION BY dd.year, c.region ORDER BY dd.month ROWS BETWEEN UNBOUNDED PRECEDING AND CURRENT ROW) AS running_total_sales,
    -- Calculated columns
    (SUM(st.sale_amount) / COUNT(DISTINCT st.customer_id)) AS average_sales_per_customer,
    CAST(AVG(p.price) AS DECIMAL(10, 2)) AS average_product_price,
    COUNT(DISTINCT c.customer_id) FILTER (WHERE c.signup_date >= DATE_TRUNC('year', dd.full_date)) AS new_customers_this_year,
    --conditional aggregation
    SUM(case when p.category = 'Electronics' then st.sale_amount else 0 end) as electronics_sales,
    SUM(case when p.category = 'Clothing' then st.sale_amount else 0 end) as clothing_sales
FROM
    sales_transactions st
JOIN
    customers c ON st.customer_id = c.customer_id
JOIN
    products p ON st.product_id = p.product_id
JOIN
    date_dim dd ON st.sale_date = dd.full_date
WHERE
    dd.year >= EXTRACT(YEAR FROM CURRENT_DATE) - 3 -- Example: Analyze last 3 years
    AND st.sale_date BETWEEN '2020-01-01' and '2024-12-31'
GROUP BY
    dd.year, dd.month, c.region, p.category
ORDER BY
    dd.year, dd.month, c.region, p.category;

-- Optionally, add indexes or constraints to the newly created table:
-- CREATE INDEX idx_sales_summary_year_month ON aggregated_sales_summary (year, month);
-- ALTER TABLE aggregated_sales_summary ADD CONSTRAINT pk_sales_summary PRIMARY KEY (year, month, region, category);

-- Example of a second CTAS table, building on the first.
CREATE TABLE monthly_region_sales_summary AS
SELECT
    year,
    month,
    region,
    SUM(total_sales) as total_regional_sales,
    AVG(average_sale) as avg_regional_sale,
    COUNT(category) as number_of_categories
FROM aggregated_sales_summary
GROUP BY year, month, region
ORDER BY year, month, region;

-- Example of a third CTAS table, creating a customer level summary.
CREATE TABLE customer_sales_summary AS
SELECT
    c.customer_id,
    c.customer_name,
    c.region,
    min(st.sale_date) as first_purchase,
    max(st.sale_date) as last_purchase,
    sum(st.sale_amount) as total_customer_sales,
    count(st.transaction_id) as total_customer_transactions
FROM sales_transactions st
JOIN customers c on st.customer_id = c.customer_id
group by c.customer_id, c.customer_name, c.region;
In[1]:
from xerini.script import Script

In[2]: code = Script.from_file("gemini_example.sql")

In[3]: dot_file = code.write_dot("gemini_example.dot")

In[4]: svg_file = code.write_svg(dot_file)

In[5]: code.keys()
Out[5]:
{'aggregated_sales_summary',
 'customer_sales_summary',
 'monthly_region_sales_summary'}

In[6]:
for stmt in code.statements:
    ...: print(f"the set {stmt.source_tables} sends data to {stmt.affected_table}.")
    ...:
the
set
{'sales_transactions', 'customers', 'date_dim', 'products'}
sends
data
to
aggregated_sales_summary.
the
set
{'aggregated_sales_summary'}
sends
data
to
monthly_region_sales_summary.
the
set
{'sales_transactions', 'customers'}
sends
data
to
customer_sales_summary
gemini_example.dot.svg |
|---|
 |
The Script object quacks like a python dictionary in which thekeys are the tables produced by the statements in the script,
In [7]: code.keys()
Out[7]:
{'aggregated_sales_summary',
 'customer_sales_summary',
 'monthly_region_sales_summary'}
and the values are the lists of statements affecting the key-table.
In [8]: print(code['customer_sales_summary'][0])
-- Example of a third CTAS table, creating a customer level summary.
CREATE TABLE customer_sales_summary AS
SELECT
    c.customer_id,
    c.customer_name,
    c.region,
    min(st.sale_date) as first_purchase,
    max(st.sale_date) as last_purchase,
    sum(st.sale_amount) as total_customer_sales,
    count(st.transaction_id) as total_customer_transactions
FROM sales_transactions st
JOIN customers c on st.customer_id = c.customer_id
group by c.customer_id, c.customer_name, c.region;
Finally, the Script object has a method called stage_decomposition that allows you to break the SQL script into stages, i.e. subsets of the SQL script that can be executed concurrently.
In [9]: stages = code.stage_decomposition()

In [10]: print(stages)
[{'customer_sales_summary', 'aggregated_sales_summary'}, {'monthly_region_sales_summary'}]
Code Structure
| Logo | dependency |
|---|---|
 |
Below is some details on the nature of the involved objects:
| Class Diagrams |
|---|
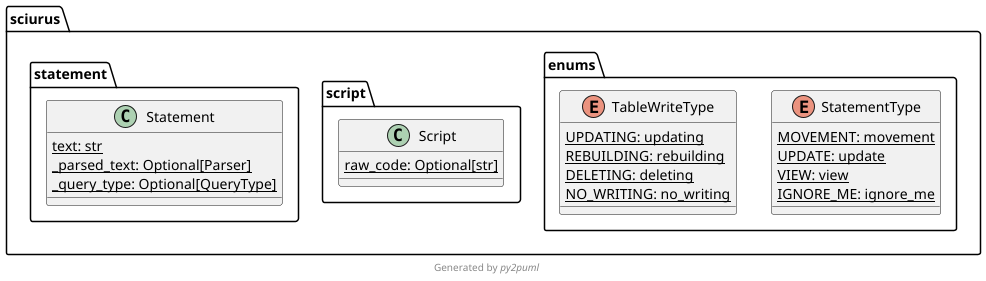 |
 |
Sciurus is a python library for dealing with large sets of SQL scripts.